
Market Updates
Oliver Stone

As the first chart below shows, June saw another very strong month for US growth stocks, proxied by the NASDAQ (pink line), which rose by 6.7%, while broad US stocks in green were also strong, rising by 4.2%.
Asian and emerging market equities also did well (yellow and orange lines), though this month neither were driven by China, which fell by 2% (purple line). Rather, returns were boosted by the likes of India which rose by 6.7%, and where returns continue to be extremely strong despite high valuations and an unexpected election result; South Korea which rose by 7.9%; and particularly Taiwan which rose by 11.7%. Taiwan is home to TSMC, the world’s most advanced producer of semiconductors and a very large component of both the MSCI Asia Pacific (9.3%) and MSCI Emerging Market (9.7%) indices, which had a very strong month in rising by 17.7%.
All of the above outweighed specific Chinese weakness and helped both broad indices do well.
Elsewhere, there were some disappointing numbers for the FTSE 250 (light blue line) which fell by more than 3% after a cocktail of worse than expected macroeconomic data, and for Europe which fell by 1.7% on French election worries.
Finally, precious metals had a more muted month with silver (light green line) falling by 4.2%. We feel that this was just a pause for breath after a very strong run up, and indeed so far in July Silver is up by nearly 4% in GBP terms:

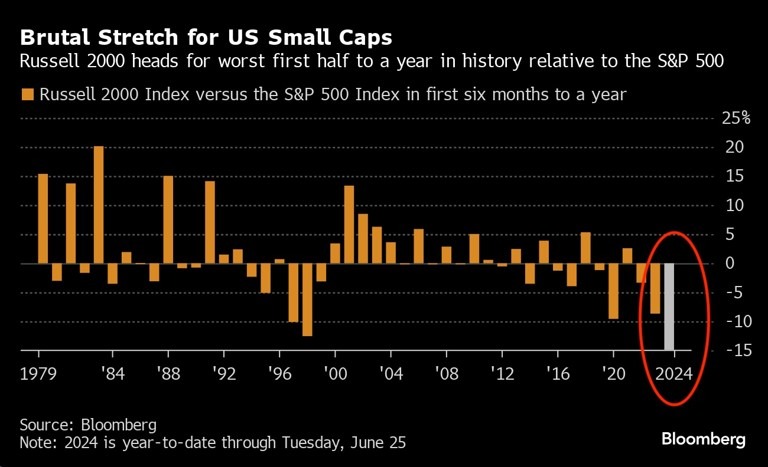
Taking a look under the bonnet of global equity returns, we find that once again smaller companies underperformed their larger counterparts substantially over the month, by around 4%. Despite over the longer term smaller companies tending to outperform larger, this underperformance phenomenon has now been playing out for more than 5 years as a result of investors’ increased focus on large technology stocks, and more recently, a higher interest rate environment which tends to be worse for smaller companies.
Smaller companies now look very cheap indeed relative to large companies, and as the chart below shows, have just suffered their worst half-year performance on a relative basis in their history, with data going back to the 1970s. This is one of the many dislocations in markets today caused by excessive optimism in parts of the equity market, and one we think will close over time.
In fixed income, as the next chart below shows, June was a positive month in the round for most areas, despite some weakness into the end of the month. Only global inflation linked bonds (light blue line) were negative, falling by 0.25%.
Again we saw some large fluctuations, but this month in general government bonds outperformed corporate bonds. We saw a sharp dip at the start of the month in line with a very strong US jobs report, but those losses were then erased by gains resulting from a slightly softer than expected US inflation print which sent yields lower and prices higher. Despite a roll down into the end of the month, most indices ended high, with UK Gilts (dark blue line) the strongest performers, rising by 1.3%.

June and very early July saw a large number of elections taking place, including of course in the UK, where, as was widely predicted, the Labour Party won itself a very large majority, while the Conservatives collapsed to their worst result in history; winning 121 seats and just 23% of the vote share, and the SNP in Scotland similarly so; losing 37 seats largely to Labour.
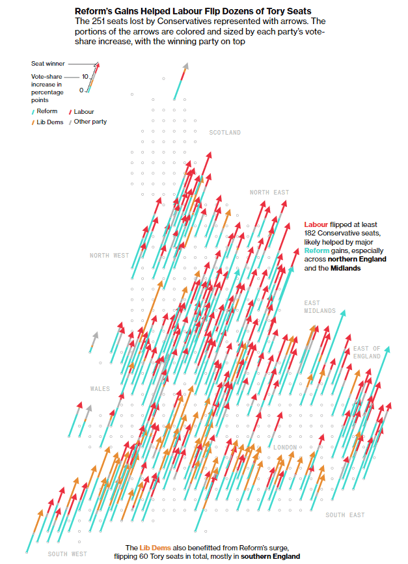
What became very clear quite quickly was that the seat gains for Labour and the Liberal Democrats were not generated by an upswell in popular support – their vote share barely budged from 2019 – but instead were largely powered by a big turnout from Reform party voters who ate into conservative party support, allowing the other parties to swoop in.
The chart below shows every seat that was lost by the conservatives represented by arrows, with each portion of the arrow coloured and sized by each relevant party’s vote share increase, and the winning party on top. As can be seen quite clearly, most of these arrows have a large chunk of light blue in them, signifying Reform voters played a major role in the flipping of seats:
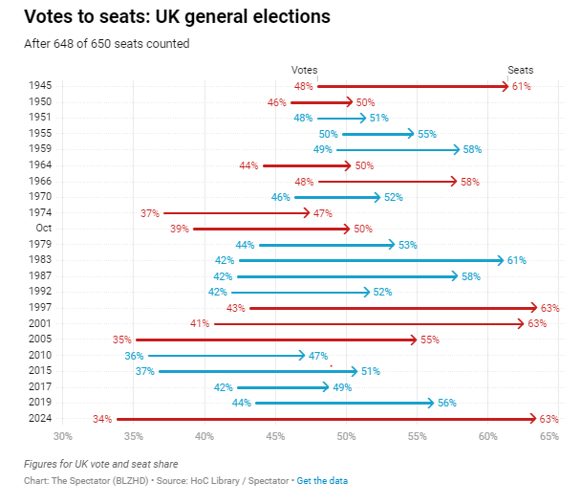
So despite the headline result, it wasn’t all plain sailing, with Labour perhaps not as popular as it might seem. We saw one of the lowest voter turnouts for 100 years, and as the chart below shows, with data going back to the 1940s, we saw by far the largest gap in recent history between vote share and seat share – Labour won 63% of seats with 34% of the vote, and further down the leaderboard, while the Reform party won 600,000 more votes than the Liberal Democrats, they won just 4 seats versus 71.
So while Labour have won the right to govern the country, they are not necessarily backed by a very high proportion of the country’s voters, meaning they have plenty of work to do to win over additional voters during the course of their term of office.
In terms of a market reaction, given the outcome was entirely in line with expectations, the price action across equities, bonds and the pound has been minimal, and from here markets will be impacted by policy implementation.
As we’ve pointed out many times before, we think the UK’s prospects look pretty good from a macroeconomic and a fundamentals point of view, with UK equities having been through a tough few years. In the lead up to the election we’ve seen decent growth momentum, with some signs that sentiment might be shifting upwards. Low valuations are a key attraction, and if the new government can deliver meaningful upside, that could turbocharge the opportunity.
As mentioned above, a large number of elections took place in June and early July, with new leadership elected in India, Mexico, South Africa and France. While we don’t have the space here to discuss each in detail, suffice to say that our main takeaway is that geopolitical volatility is here to stay, with a lot of surprising results that have resulted in very sharp market movements; both positive and negative.
One upcoming election that we will briefly touch on is the increasingly bizarre situation unfolding in the US, where the Presidential election isn’t until November, but is making headlines for all the wrong reasons.
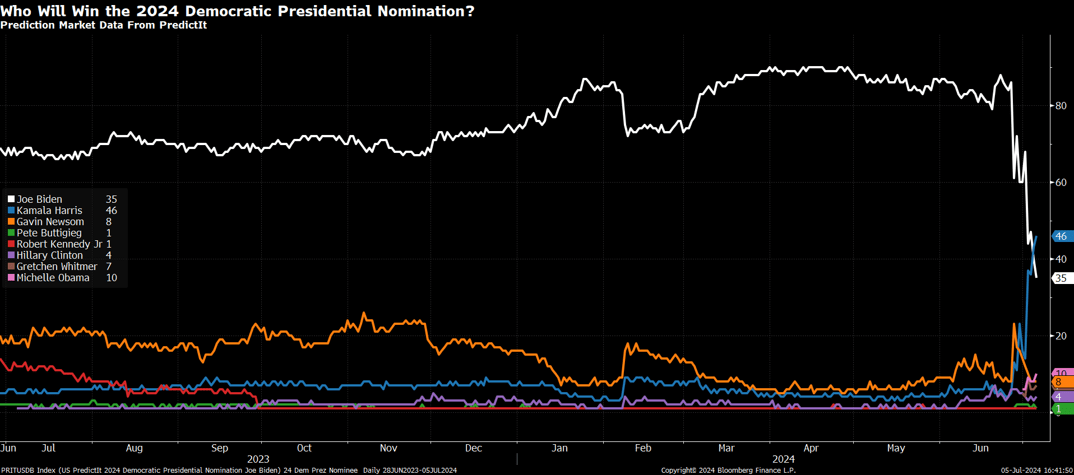
The chart below shows the odds of various candidates to be the Democrat nominee, where following the disastrous Trump/Biden debate in June, Vice President Kamala Harris (blue line) has surged ahead of Joe Biden (white line).
For now, Biden and his team are still insisting that he’ll stay in the race, but in the background there’s a lot of horse trading around a potential replacement, and with another debate on 10th September still to come, and 4 months to go until the election itself, there will be plenty of volatility to come.
We think this domestic uncertainty adds another layer of risk to high US equity valuations which is why we’re still happy to be underweight the most expensive stocks there.
We have over 1000 local advisers & staff specialising in investment advice all the way through to retirement planning. Provide some basic details through our quick and easy to use online tool, and we’ll provide you with the perfect match.
Alternatively, sign up to our newsletter to stay up to date with our latest news and expert insights.
| Match me to an adviser | Subscribe to receive updates |
The value of investments may fluctuate in price or value and you may get back less than the amount originally invested. Past performance is not a guide to the future. The views expressed in this publication represent those of the author and do not constitute financial advice.
For further information, please contact:
For further information, please contact:

